


Summer Flounder Management – Can it get any worse?
October 19, 2016
Nils Stolpe/FishNet USA
Note: The Maguson-Stevens Fisheries Conservation and Management Act National Standards Guidelines were just changed (see https://www.federalregister.gov/documents/2016/10/18/2016-24500/magnuson-stevens-act-provisions-national-standard-guidelines) and it appears as if the added flexibility, which fishermen have been asking for since the last reauthorization of the Act, will help to avoid situations such as this in the future.
Summer flounder, also known as fluke, support recreational and commercial fisheries that are among the most important in the mid-Atlantic and southern New England. They have been a mainstay of recreational fishermen either from their own boats or on for-hire vessels, support a large directed commercial fishery, their incidental harvest is important in other fisheries and they are near the top of the list of must-have meals for summer visits to the shore. Hundreds of party and charter boats depend on them for all or for part of their annual incomes, thousands of private boats seek them out every summer, and much of the business bait and tackle shops do every year depends on the fishery. Hundreds of commercial fishing boats target them or take them incidentally in other fisheries
To say that the summer flounder fishery is important to tens of thousands of people from Cape Cod to Cape Hatteras would be an understatement.
In 2010 the summer flounder stock was declared to be rebuilt. Quotas were significantly higher than they had been when the stock was rebuilding.
Management efforts to control fishing mortality in the face of increasing stock abundance and competing demand for fish from both the commercial and recreational sectors continue to evoke the question of “How much fish is enough?” to provide for long-term sustainability. In spite of the numerous controversies, however, by 2010 the fishing mortality on summer flounder had declined to its lowest level in at least 30 years, and summer flounder stock biomass was the highest since the stock assessments began in the 1960s (From The summer flounder chronicles II: new science, new controversy, 2001–2010, M. Terciero, Reviews in Fish Biology and Fisheries, Dec 2011)
In the summer flounder stock assessment that was done in 2012 it was reported that for the five previous years “fishing mortality has been retrospectively overestimated” and that for the six previous years “SSB (spawning stock biomass) has been retrospectively underestimated.” Most simply stated, it was decided that there were more summer flounder and that summer flounder fishing mortality had been less than had been previously estimated.
The summer flounder stock assessment has historically exhibited a retrospective pattern of underestimation of F; the causes of this pattern have not been determined. For the last 5 terminal years, however, fishing mortality has been retrospectively overestimated.
The assessment has historically exhibited a retrospective pattern of overestimation of SSB; the causes of this pattern have not been determined. For the last 6 terminal years, however, SSB has been retrospectively underestimated. (Emphasis added)
http://www.nefsc.noaa.gov/publications/crd/crd1221/crd1221.pdf , pg 20/21
But in a memo dated 25 July 2016, the Chairman of the Mid-Atlantic Fishery Management Council’s Scientific and Statistical Committee (SSC), wrote “the revised understanding of the stock status produced by the assessment update indicates reductions in the estimates of SSB, and increases in the estimates of annual Fs.” So five years after declaring that the summer flounder stock was at its highest level in half a century it was determined that fishing mortality was greater and there were fewer summer flounder than was previously estimated.
The SSC “recommended revised 2017-2018 ABCs that reverted to the typical Council risk policy, due to concerns about the status of the summer flounder stock, including the potential for summer flounder to become overfished in the near future.”
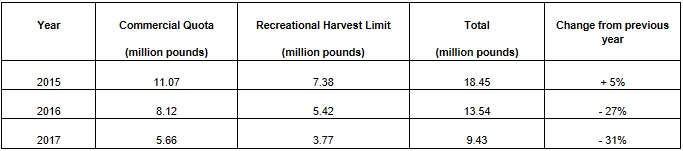
So for next year both the recreational and commercial quotas for summer flounder will be 31% below this year’s levels. This is on the heels of a 27% reduction in the quota this year from what it was in 2016.
(Updated from http://www.asmfc.org/uploads/file/55d1f9bdpr28Mid-AtlanticMulityearSpecs.pdf)
The SSC also reported that “retrospective patterns were evident in the assessment update that have substantial implications for the reliability of model projections and inferences regarding the status of the stock. The causes of the retrospective pattern are unknown.”
The summer flounder stock has gone from having the highest biomass in 50 years to being on the verge of overfishing in the five years between 2011 and 2016. While no one seems to know why the management program hadn’t been working, the SSC did come up with several possibilities. These included “sources of (fishing) mortality that are not fully accounted in the assessment. These could include under-estimation of discards in both the commercial and recreational fisheries and lower estimates of mortality rates applied to the discards than are actually occurring.”
And summer flounder are not being overfished. The draconian cuts are designed to avoid the possibility of their being overfished.
It kind of makes you wonder in how many years it will be before it’s decided via another retrospective analysis that there are actually more summer flounder and that the fishing mortality is actually lower.
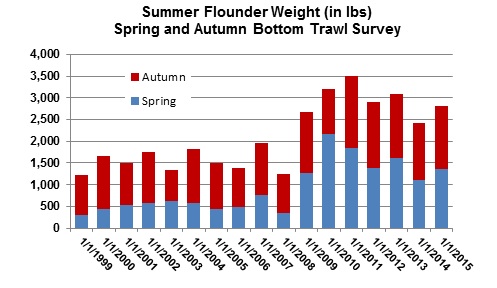
NOAA’s Northeast Fisheries Science Center’s Spring and Autumn Bottom Trawl Surveys – supposedly the “gold standard” in trawl surveys – up until 2015 don’t show any change in abundance that would warrant such a devastating reduction in the summer flounder quota until 2018. (Note that in 2009 the R/V Bigelow replaced the R/V Albatross as the survey vessel, This accounts for the significant increase in the relative biomass).
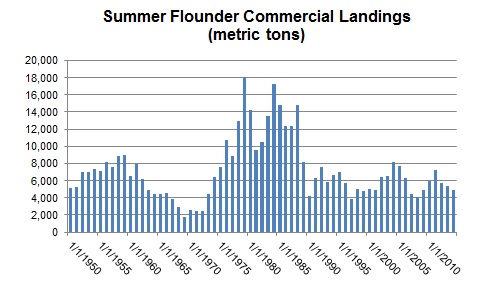
What has it taken for the fisheries managers to get summer flounder landings down to what is almost an all-time low (since 1950 they have only been lower in 1969, 1971 and 1972)? A far from exhaustive review of the public records showed that since 1987, when the Summer Flounder, Scup and Seabass Fishery Management Plan was approved by the U. Secretary of Commerce, a series of at least 100 meetings resulted in more than 8,000 typed pages devoted largely (but not exclusively) to summer flounder management. Assuming at least a dozen attendees at each of those meetings, a two day investment of time, travel expenses and etc. by the participants and the cost of writing, editing and distributing those 8,000 plus pages, the cost to the taxpayers must be well into six figures.
Looking back
In 1976, federal management of marine fisheries was virtually non-existent. With the exception of state managed waters, federal activities were limited to supporting a patchwork of fishery-specific treaties governing international waters, which at that time existed only 12 miles off our nation’s coasts. A primary impetus of the Magnuson Act was to extend the U.S. exclusive economic zone (EEZ) out to 200 miles and eliminate competition from the foreign fishing fleets off our coasts. (From The Road to End Overfishing: 35 Years of Magnuson Act – Assistant Administrator for Fisheries Talks about the Cornerstone of Sustainable Fisheries at http://www.nmfs.noaa.gov/stories/2011/20110411roadendoverfishing.htm)
So, with “virtually non-existent” management – and the quote above is from the head of the National Marine Fisheries Service – of the summer flounder fishery in twenty-three of the twenty-six years from 1950 (the earliest that commercial landings are available) until 1976, when the Magnuson Act became law, commercial summer flounder landings were higher than they will be in 2017. And back then there were no minimum mesh sizes, no limited access to the fishery, no trip limits, no reporting, in fact not much of anything beyond fishermen catching summer flounder.
Annual summer flounder landings from 1950 to 2014 averaged 7,200 metric tons. The 2017 quota will be a little over one third of that. And all of those scientists and bureaucrats with all of those computer models and all of those opportunities to interact in seaside resorts from Cape Hatteras to Cape Cod didn’t see it coming? How can anyone not ask what all of those meetings, all of those pages of reports, all of those salaries and expenses, and especially all of the trouble and aggravation and deprivation inflicted on the fishermen and on those in associated businesses have been for?
NOAA’s Northeast Fisheries Science Center’s Spring and Autumn Bottom Trawl Surveys – supposedly the “gold standard” in trawl surveys – up until 2015 don’t show any change in abundance that would warrant such a devastating reduction in the summer flounder quota until 2018. (Note that in 2009 the R/V Bigelow replaced the R/V Albatross as the survey vessel, This accounts for the significant increase in the relative biomass).
What has it taken for the fisheries managers to get summer flounder landings down to what is almost an all-time low (since 1950 they have only been lower in 1969, 1971 and 1972)? A far from exhaustive review of the public records showed that since 1987, when the Summer Flounder, Scup and Seabass Fishery Management Plan was approved by the U. Secretary of Commerce, a series of at least 100 meetings resulted in more than 8,000 typed pages devoted largely (but not exclusively) to summer flounder management. Assuming at least a dozen attendees at each of those meetings, a two day investment of time, travel expenses and etc. by the participants and the cost of writing, editing and distributing those 8,000 plus pages, the cost to the taxpayers must be well into six figures.
Looking back
How can so many smart and well educated people with access to state of the art resources (including a fifty million dollar, designed for the job, 209’ long, state-of-the-art survey vessel) appear to be so befuddled?
Of course there’s always the “blame it all on global warming/climate change” explanation. That seems to be a catch all for explaining away any natural phenomenon that isn’t understood.
But there’s also the fisheries scientists’ penchant for automatically assuming that when dealing with a fish stock the only variable at work on that stock is the amount of that species that is killed by fishing.
Natural mortality, referred to as “M,” is considered to be a constant in fish stock assessments, and is the sum total of all of the things that will kill the fish other than fishing. Fishing mortality, “F,” covers the remaining mortality. So when the scientists and managers estimate that there aren’t enough fish in a stock, with natural mortality treated as constant it appears as if it is automatically assumed that fishing mortality is the cause.
Some people, generally either the scientists/managers who are responsible for the management plans or the anti-fishing activists who consider it a really good day when there’s a major reduction in quota and a great day when a fishery is closed down, push a “so what, we can’t do anything to manage natural mortality” attitude. That is the case today, but if we were really interested in managing fisheries rather than managing fishermen, it wouldn’t be.
Let’s take a fairly obvious example, the contribution of spiny dogfish to the natural mortality of summer flounder (and other important fish species as well). All one needs are rudimentary observational skills and some significant time on the water to know that spiny dogfish are voracious predators and that there are an awful lot of them on our side of the Atlantic from Cape Hatteras northward.
According to the latest estimates the spiny dogfish SSB (Spawning Stock Biomass) is 371 million pounds, or 168,207 metric tons. Assuming that the total biomass is 2.75 times the SSB (that’s the official conversion factor), there are just over 1 billion pounds of spiny dogfish off the Northeast coast (and I’ll note here that University of New England researcher James Sulikowski has done satellite tagging work that indicates that there might be significantly more than that (http://journals.plos.org/plosone/article?id=10.1371%2Fjournal.pone.0103384). For the last several years commercial landings of spiny dogfish have hovered around 20 million pounds annually. That’s two percent of the total biomass.
“From a practical aspect the spiny dog in the Western Atlantic is chiefly important because it is undoubtedly more destructive to gear and interferes more with fishing operations than does any other fish – shark or teleost…. In the Gulf of Maine, the spiny dogfish feed on a wide variety of species and at one time or another prey on practically all species smaller than themselves. They are regarded as the chief enemy of the cod, and also feed on mackerel, haddock, herring, squid, worms, shrimps, crabs.” (Jensen, Edwards and Matthiessen, The Spiny Dogfish – a Review, 1961, Woods Hole Laboratory Report No. 61- -7 available at
http://www.nefsc.noaa.gov/publications/series/whlrd/whlrd6107.pdf).
Researchers Wetherbee and Cortés report that spiny dogfish consume between 0.4% and 2.6% of their total body weight per day. If we assume a intermediate level of 1.5% per day, each dogfish consumes its own weight every 60 days, or six times its body weight every year. (Wetherbee, B.M. and E. Cortes. 2004. Food consumption and feeding habits. Pp. 223-244 in: Biology of sharks and their relatives. Musick, J.A., J.C. Carrier and M. Heithaus, eds.)
The billion pounds of spiny dogfish are eating six times their weight of fish and shellfish annually. That’s six billion pounds. For an idea of how much eating this is, in 2014 the total commercial landings of finfish and shellfish in the Mid-Atlantic and New England were 800 million pounds. Spiny dogfish consumed seven and a half times more fish and shellfish than all of the commercial fishing boats from North Carolina to Maine landed.
In the following table I’ve listed species (from Bigelow and Schroeder, Fisheries of the Gulf of Maine) eaten by spiny dogfish and three other important fish species. When they aren’t eating each other these fish are eating the critters that their “competition” is eating, and by both total numbers and by disposition the spiny dogfish are unquestionably out-competing these listed species as well as others that haven’t been listed.
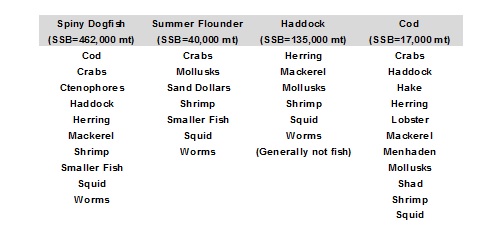
Spiny dogfish obviously interact with a number of fish and invertebrate species, directly and/or indirectly, and it’s impossible to assume that those interactions are to the benefit of those other species. Those unfavorable interactions are all lumped into what the managers term Natural Mortality, and they are assumed not to vary from year to year.
The following chart (from the Atlantic States Marine Fisheries Commission at http://www.asmfc.org/species/spiny-dogfish) shows the spiny dogfish spawning stock biomass (total biomass would be 2.75 times the SSB for each year) from 1991 to 2015, increasing from about 100 million pounds in 2005 to 350 million pounds in 2015. Yet if there are not enough summer flounder (or haddock or cod or bluefish or scup or a whole bunch of other finfish or shellfish that are unfortunate enough to interact with spiny dogfish), it has to be because of fishing mortality. So cut back on fishing for them, of course!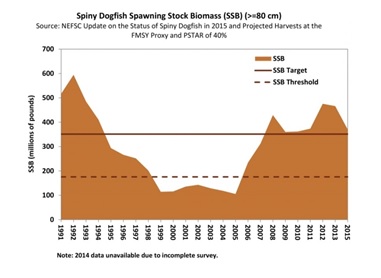
The Mid-Atlantic Fishery Management Council is supposedly shifting to an “ecosystem-based approach for more comprehensive management of fisheries.” In its Ecosystem Approach to Fisheries Management (EAFM) Guidance Document, EAFM is defined as the recognition of the biological, economic, social and physical interactions among the components of ecosystems and the Council will be attempting to manage fisheries to achieve optimum yield taking those interactions into account. (J. Rowley, Commercial Fisheries News, October 2016). The Council would do well to focus on the impacts of spiny dogfish predation on and competition with summer flounder on achieving optimum yield for its first venture into serious EAFM.
As it is being interpreted, the Magnuson-Stevens Act demands that spiny dogfish fishing mortality be held to what is an unrealistically low level. If ecosystem based management actually means what it sounds like, and if federal fisheries management policy was actually based on providing the highest return from our fisheries, we would be using fishing as a management tool, reducing the abundance of such predator species to more reasonable levels and maximizing the abundance of the more valuable species that they either consume or are in competition with.
We’ve declared all-out war on lionfish, an exotic species that is finding a home on our Atlantic Coast. We don’t need a war on dogfish, we just need a reasonable police action.
———————————————
In a recently completed trawl survey comparing the ability of a rock hopper equipped net (as used by the R/V Bigelow in the Autumn and Spring trawl surveys since 2009) towed on one side of a commercial fishing vessel with a net equipped with a chain sweep (as used by commercial fishermen to harvest flatfish) on the other, the latter net outperformed the former by a significant margin. While the difference was more pronounced with other flatfish species, as the length/frequency plot to the left shows, with a total catch of 2,582 summer flounder the net with a chain sweep caught noticeably more than the net with the rock hopper.
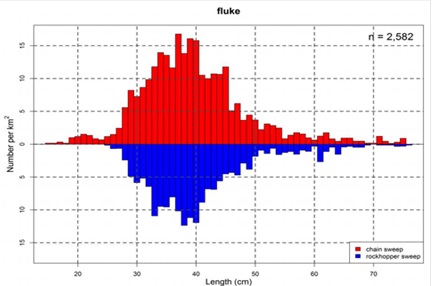
This was reported to the Mid-Atlantic Fishery Management Council on May 31 of this year by Michael Martin from the Ecosystems Surveys Branch at the NOAA/NMFS Northeast Fisheries Science Center. The goal of the study was “To estimate relative catch efficiency for standard BTS (bottom trawl survey) rockhopper sweep for several flatfish species.” The commercial fishing vessel used was the Karen Elizabeth out of Point Judith, RI. (https://www.mafmc.org/s/
This was from a preliminary report on the project and should not be considered as a final determination.