What was being caught and where back to 1950
Nils E. Stolpe/FishNet USA www.fishnet-usa.com/
What is the status of commercial fishing in the U.S. Exclusive Economic Zone, the waters from 3 to 200 miles off our coastline? Generally speaking – something that the “bureaucrats in charge” have developed a great deal of facility in doing – it’s pretty good. Since the National Marine Fisheries Service started getting serious about tracking commercial landings (or at making those landings readily accessible) in 1950, the total weight of our domestic landings has increased from 4.9 billion to 9.8 billion pounds. The value of those landings, when corrected for inflation, has increased from $3.3 billion to $5.2 billion, almost as good.
Obviously this is welcome news for the fishing industry as a whole and for many people in or economically dependent upon the industry. But what does it mean to the individual fishermen, dock owners, wholesalers, retailers and restauranteurs, and the tens of thousands of people whose jobs depend on locally produced seafood?
The ups and downs in the weight and the value (in inflation corrected dollars) in the 491 commercial fisheries currently covered in the NOAA/NMFS Commercial Landings database (up from 484 species in 2015 and from 221 species in 2015) are among the primary determinants of the economic wellbeing of the participants in domestic fisheries and in fisheries-dependent businesses (others are the availability/cost of imported “substitutes” and the latest alarmist rantings from the anti-fishing activists).
It would be a really big job to track the annual landings’ weights and values of all of these species for over seventy years, and the final result would be a huge amount of data that at best would be cumbersome to use. What I’ve done instead is track the landings’ weights and inflation corrected values for every reported species for every fifth year starting in 1950 and made them available in a downloadable spreadsheet at http://www.fishnet-usa.com/Landings 5 yr.xlsx. (the weights in the year caught are from the NMFS Commercial Landings database at https://www.st.nmfs.noaa.gov/commercial-fisheries/commercial-landings/annual-landings/index* and the values were corrected for inflation using the U.S. Bureau of Statistics inflation calculator at https://www.bls.gov/data/inflation_calculator.htm. There were 221species listed in 1950 and have increased from then on).
Note: If you are familiar with spreadsheets just ignore the next several paragraphs, open the attached/linked file and have at it.
You will need a spreadsheet program, Microsoft Excel – $$$ to buy – or Apache Open Office Calc – for free – to open http://www.fishnet-usa.com/Landings 5 yr.xlsx. which is included as an attachment to this email and linked as well. Open Office is available at https://www.openoffice.org/. Or you can save the file to your hard drive, – noting where it’s located – go to http://www.drive.google.com, click on “My Drive,” locate the file on your hard drive and double click on it. That will open the file in Google Sheets (another freebie, but you aren’t downloading the software to your computer, it remains on the web).
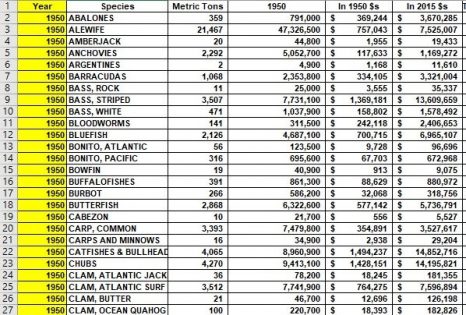
When you have the spreadsheet opened click on the first tab on the bottom of the page, which is labelled “All Fisheries_5 Year.” You will find listings of the recorded landings and their value at the dock when they were landed. I also calculated their value in 2015 dollars, to make them comparable for each year.
All species are listed alphabetically (by their most commonly accepted name, but be aware that that’s not necessarily the name you are most familiar with) to facilitate following particular species.
If you were interested in tracking summer flounder you would clicking scroll all the way to the left then down to “FLOUNDER, SUMMER” (which I have highlighted by using a yellow background).
You would find that 5,124 metric tons (11,296,500 pounds) of summer flounder worth $1,897,140 in 1950 or $18,857,572 in 2015 dollars were landed by the commercial fishing industry in the U.S.
In 1955 the corresponding figures were 7,160 metric tons, 15,785,000 pounds, $2,842,899, and $25,159,656.
For illustration, I have also highlighted Acadian redfish with a green background, Atlantic herring with red, menhaden with blue and Pacific sardines with grey.
You could then take the summer flounder (or whichever fishery you’ve chosen) data line by line for each fifth year, paste it into a new spreadsheet and chart the changes as I did on the “Summer Flounder” tab. In all three spreadsheets you get there by clicking on the Summer Flounder tab at the bottom of the screen in the spreadsheet.
On another tab (“Top 30 species”) again at 5 year intervals starting in 1950, I have listed the top 30 fisheries (by weight) along with their inflation corrected landed values. Also on that tab are the %s of maximum landings for four species (Menhaden, Pacific Sardines, Atlantic Herring and Acadian Redfish) to give you an idea of the variability of species abundance and/or market demand for different species.
As would be expected, the weight and value of some fisheries have increased, of some have decreased, and some have remained more or less constant. These can be roughly related to the passage and implementation of the Magnuson Act, the development of “new” fisheries in Alaska and the development of fisheries as alternatives to more traditional fisheries that have been judged to be overfished (long-time readers be familiar with some of the controversy that has arisen concerning the determination that some of them have been or are still being overfished).
This might seem a bit complicated, but it really isn’t, and it’s an effective way to see where fisheries have been, where they were in 2015 and where they’re going.
If you’re familiar with spreadsheets you should have no problems. If you aren’t, you should be because the NOAA/NMFS Commercial Landings database has a wealth of information about our fisheries that could well prove invaluable to your decision-making. There are all sorts of free tutorials available on the internet, and it should be fairly easy to find someone who can give you a hand.
If you run into any problems, give me a shout and I might be able to lend a hand.
____________________
*The linked database contains a wealth of information in an easy-to-use form. For the species listed you can retrieve domestic landings data – weight and value – by species, by (consecutive) years and by location (see below). The data is available as a table or ASCII file (PC or UNIX). As alluded to above, you might have to go thru an extra step or two to determine how specific fisheries are listed in the database (i.e. it’s “flounder, summer,” not “summer flounder” or “fluke”), and you can also retrieve either “ALL SPECIES COMBINED” or “ALL SPECIES INDIVIDUALLY” for each state, region, ocean or nationally.
From the database search page: Areas are arranged in geographical order by subregion. For example, the option “New England By State” will give you the landings for each of the five states listed after the option (Maine to Connecticut). The “New England” option will give you the total combined landings of the five states. The NOAA Fisheries “Chesapeake” Region includes bay and oceanic landings for Maryland and Virginia. Florida is divided into three areas (east coast, west coast, and inland waters) in our surveys. Florida east coast and inland water landings are summarized with South Atlantic states and Florida west coast landings are summarized when Gulf landings are requested. The only way to get total Florida landings (west+east+inland waters) is to select the “Florida, State Total” option. Commercial landings for Washington, Oregon, California, Hawaii and Alaska are listed under the Pacific region.