


After over forty years of NOAA/NMFS management how are we really doing? Nils Stolpe
Nils E. Stolpe/FishNet USA
© 2019 Nils E. Stolpe
June 1, 2019
After over forty years of NOAA/NMFS management how are we really doing?
I have devoted well over two decades to familiarizing myself with and writing about various aspects of the domestic commercial fishing industry. I hope I’ve done it in a way that provides a reasonable amount of insight into what are large-ly complex and too often confusing issues.
Since being involved in the industry – and this involvement goes as far back as the passage of what is now called the Magnuson-Stevens Fishery Conservation and Management Act – I have seen the focus of government fisheries manage-ment increasingly shift away from the fishermen to the fish. The provisions of the Act as it was originally written were put in place to allow the U.S. fishing industry to regain control of the fisheries in the United States’ highly productive coastal waters, fisheries which had been for the most part taken over by the distant water fleets of other fishing nations.
The legislation was singularly effective, so effective that within ten years or so of its passage the greatest portion of our domestic fish and shellfish production was being harvested by U.S. fishermen on U.S. vessels.
This success was sold to the U.S. public – and the U.S. politicians – as an assault on the “sanctity” of our coastal waters by a burgeoning environmental industry that was (and still is) engaged in non-governmental empire building. This has resulted in a handful of multi-national ENGOs (Environmental Non-Governmental Organizations) that have become at least as influential as the fishing industry in national and international fisheries management.
With huge staffs and huge public relations budgets they have successfully shifted the focus from profitably harvesting to sustainably harvesting fish
and shellfish.
This shift in focus is nowhere more obvious than in the Annual Report to Congress on the Status of U.S. Fisheries (the most current Report, for 2017, is available at http://tinyurl.com/yc7ufkal).
A check on the web shows that the term “fishery” includes the fish (or shellfish), their habitat, the people who catch (or grow) them, and what they use to capture (or grow) them is accurate. According the Merriam-Webster online dictionary the definition of “fishery” is:
1 – The occupation, industry, or season of taking fish or other sea animals (such as sponges, shrimp, or seals
2 – A place for catching fish or taking other sea animals
3 – A fishing establishment – also its fishermen
4 – The legal right to take fish at a particular place or in particular waters
5 – The technology of fishery —usually used in plural
According to the folks at Merriam-Webster, as well as the fish or other sea animals a fishery includes the people who catch them and all of the other mechanisms, legislation, and institutions that allow them to be caught.
Yet according to NOAA/NMFS, the status of our fisheries obviously involves only the fish. With over 2,300 words in the 2017 annual report linked above, by my count only 75 of those words did not relate solely to the fish or to the condition of those fish. Those few are:
Combined, U.S. commercial and recreational saltwater fishing generated more than $208 billion in sales and
supported 1.6 million jobs in 2015…. The need to increase our nation’s seafood production is a continuing and
growing challenge…. NOAA Fisheries is focusing on a number of activities aimed at leveling the playing field for
our domestic seafood industry. These include increasing seafood trade opportunities and market access so that
we can remain competitive with other seafood exporting countries….
That’s it!
While this should be slightly less than a surprise to anyone in, associated or familiar with the commercial fishing industry, it’s fairly obvious that the federal agency that is supposedly concerned with the management of all facets – human and piscine – of our fisheries has pretty effective blinders on when it comes to “managing” anything but the fish. And going a step further, that management has as its overriding goal the health (or sustainability if you would rather) of those fish. The rest, which should include the welfare of the fishermen and all of the businesses that are directly or indirectly fisheries dependent, doesn’t matter to NOAA/NMFS – and apparently NOAA/NMFS has decided that it shouldn’t matter to Con- gress – or to the citizens of the U.S. – either.
So Congress gets an annual rundown on the well-being, by species and en masse, of the fish in U.S. waters and virtually nothing about the well-being of the other components of the fisheries; the people who and the businesses that catch, pro- cess, buy, sell and eat them.
In light of this (purposely?) myopic vision of our fisheries, how are we to gauge how well the people at NOAA/NMFS are doing one of their primary jobs, managing our fisheries, by using a more inclusive definition of the term? I doubt that anyone reading this would be surprised by the answer “not so easily.”
Each year NOAA/NMFS also publishes Fisheries of the United States, the most recent being for 2017 (http://tinyurl.com/y5e8sjy6). In the words of NOAA/NMFS:
Fisheries of the United States, published each fall, has been produced in its various forms for more than 100 years. It is the NOAA Fisheries yearbook of fishery statistics for the United States. It provides a snapshot of data, primarily at the national level, on U.S. recreational catch and commercial fisheries landings and value.
In addition, data are reported on U.S. aquaculture production, the U.S. seafood processing industry, imports and exports of fishery-related products, and domestic supply and per capita consumption of fishery products. The focus is not on economic analysis, although value of landings, processed products, and foreign trade are included.
Each annual Fisheries of the United States report contains a wealth of information on commercial landings for the year of publication and the previous year (i.e. the 2017 report has commercial landings for 2017 and 2016) and in a few in- stances goes back slightly farther.
However, a one or two year snapshot doesn’t show much about fisheries trends, or about the success – at least from a fishing industry perspective – of management efforts. And said most simply, though anti-intuitively, the status of the fish stocks no longer has an awful lot to do with the status of the human components of the fishery.
But, and this might come as surprise to most federal and state fisheries managers, there are other measures of how well they are doing at managing our fisheries, and among the most important is – or should be – how well the fishermen and those in fishing dependent businesses, who once were supposed to be much of the reason for spending hundreds of millions of taxpayer dollars each year on fisheries management, are doing.
When is the last time that anyone from the Fed asked you how you were doing? And when was the last time that you saw any federal pronouncements dealing with how well the fishermen, the lumpers, the processors, the sellers, the truckers or anyone else whose life depends on fishing, were doing?
So why all of the graphs going back to 1950?
There are unquestionably a number of ways in which the success/satisfaction of people in the fishing industry can be measured. I’ve picked, however, the most simple; the value of annual landings in a particular fishery compared to the value of previous years’ landings in that fishery.
Particularly in this age of limited access, the luxury of being able to switch to other fisheries is one that only a very few fishermen can afford. Hence what you “earned” in prior years in a particular fishery should generally be a reasonable measure of how well you’ve done subsequently. (The volatility in the price per pound in some fisheries makes the weight of fish landed less important to the fishermen than the value of their catch. The generalization that most fishermen are fishing for money is usually accurate.)
Accordingly I looked at the catch value estimates from the NOAA/NMFS Commercial landings database at https://www.st.nmfs.noaa.gov/commercial-fisheries/commercial-landings/annual-landings/index. To allow realistic year-to-year comparisons, I corrected the value of each year’s landings for inflation, expressing them in 2017 dollars by using the US inflation calculator at https://www.usinflationcalculator.com/. All of the graphs were done with Microsoft Excel 2010. (Initially I’m limiting this to Atlantic coast landings. The same data is available for the Gulf of Mexico, Pacific and Alas-
ka fisheries but I’ll keep an Atlantic focus here.)
The total value of Atlantic commercial landings was determined by multiplying the annual values of “All Species Combined” from each year from 1950 to 2017 by the appropriate inflation correction. The value of all species combined in 1950 was three hundred and thirty-six million dollars, which using the inflation calculator linked above yields the equivalent of three billion four hundred and twenty million dollars in 2017.
Because I am comparing individual fisheries that had annual landings ranging from hundreds of thousands to hundreds of millions of dollars, I graphed annual landings (of individual fisheries as well as total fisheries combined) as a percentage of the maximum landings. For example, the inflation corrected maximum value of all landings was $2,249,921,045 in 1979, represented by 100% in Chart 1. It was $1,969,770,533 in 2017, 88% of the maximum.

The average for total Atlantic landings from 1950 to 2017 when corrected for inflation was $1,888,500,000, which was below the 2017 landings maximum. All things considered, in 2017 being 4% above the yearly average value of landings since well before Magnuson management began (the Act became law in 1976) seems fairly decent management performance.
But unfortunately for many fishermen and people in fishing dependent businesses, the devil is in the details, and not too surprisingly – at least to those of us familiar with the commercial fishing industry on the East coast – those details present a picture much less rosy than the bigger picture up above.
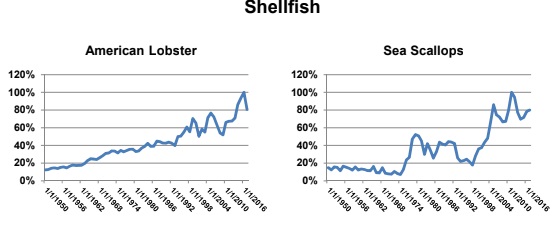
As Chart 2 below shows, The American lobster and sea scallop fisheries, currently the two most valuable fisheries on the
East coast, when corrected for inflation have each more than doubled in value since the passage of the Magnuson Act.
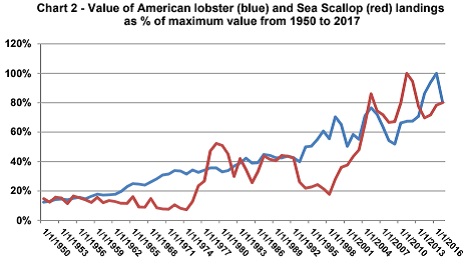 Conversely the combined landings in all of the other fisheries have been just about halved in the same period. As Chart 3 below shows, the booms in the lobster and scallop fisheries haven’t been accompanied by corresponding booms in many of the other fisheries. In fact the situations in some of those fisheries can best be described as busts.
Chart 3 shows the value of all Atlantic coast landings minus lobsters and sea scallops. This indicates a relatively steady decline since the peak of one point six billion dollars (inflation corrected) in 1979. The minimum of seven hundred and sixteen million dollars was landed in 2009 and there has been a slight increase since then, but in 2017 landings minus sea scallops and lobster were less than 60% of what they were at their peak.
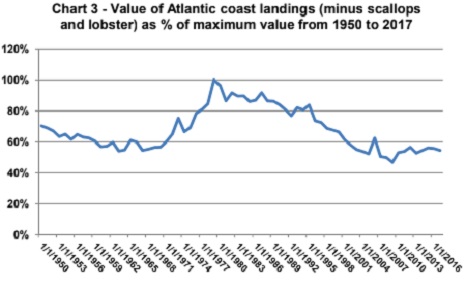 These two charts tell a fairly sad story about most of the Atlantic coast commercial fishing industry since the passage of the Magnuson Act, at least as far as the “management” part is concerned. Thanks to a fortuitous confluence of factors, what were the two most valuable fisheries on the U.S. east coast were still the most valuable in 2017 and their relative values have more than doubled, but for most of the other fisheries this is far from case.
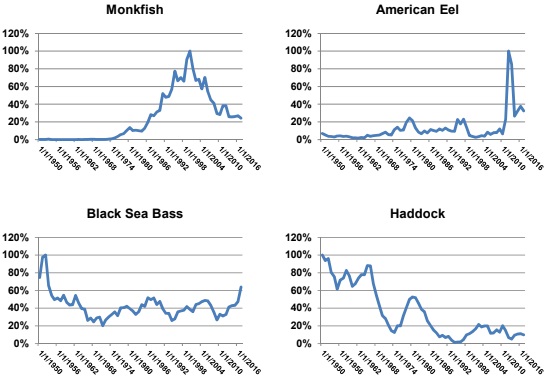
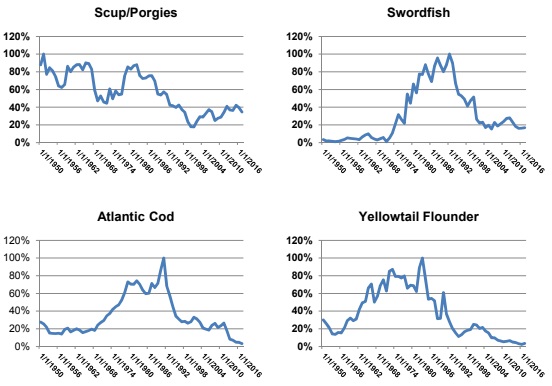
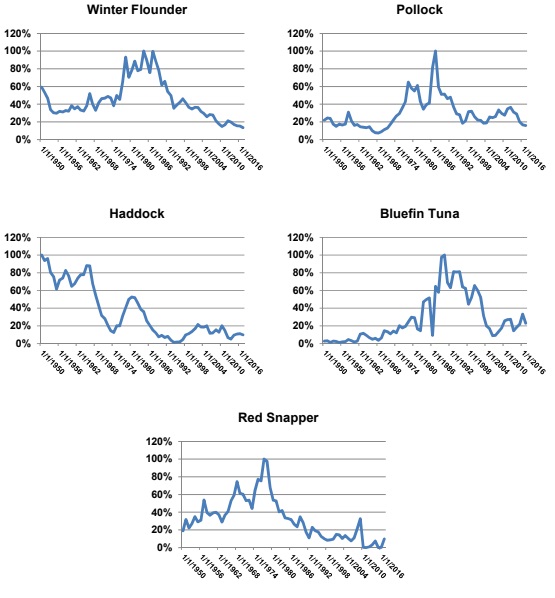
Below are charts for the twenty four Atlantic coast fisheries that were most valuable Atlantic coast fisheries – both finfish and shellfish – in 2017 (the catch-all category “Shellfish,” which was the 15th most valuable, was omitted). Of the seventeen most valuable finfish fisheries, the value of three relatively minor commercial fisheries – striped bass,
American eel and black sea bass – have had landings that have increased in value since the passage of the Act, and “modern” fisheries management began in the late 1970s. The remaining fourteen have decreased in value, and most have in fact plummeted.
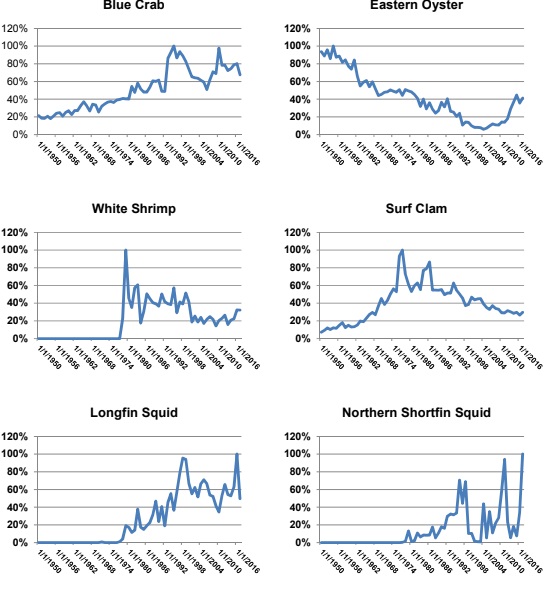
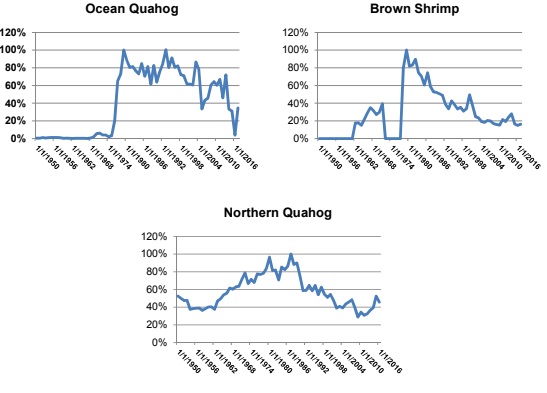
Of the thirteen shellfish fisheries only six could be described as plummeting in value, the other seven appearing to have increased significantly (though the two squid fisheries and the Jonah crab fisheries are new fisheries which were insignificant pre-Magnuson).
(Note that the reported value of the Atlantic herring catch from 2004 to 2006 appear to be anomalous. However, my query to NOAA/NMFS regarding possible reasons for this wasn’t responded to. I have also included several species which, while “historically” important were no longer in the most valuable 25 fisheries in 2017.)


Does this bode well for our Atlantic fisheries? Not hardly. Two fisheries are accounting for about 50% of the total value of landings. What’s going to happen if either the sea scallop or the lobster fishery suffers a significant setback? How much of the Atlantic coast commercial fishing infrastructure depends on the continued success (and growth?) in these two fisheries, and do any alternatives exist if they become necessary?
So while it’s well and good that the Federal agency that is charged with managing our fisheries is becoming fairly proficient at blowing its own horn (see The Surprising Story of Swordfish You May Not Know at https://www.fisheries.noaa.gov/feature-story/surprising-story-swordfish-you-may-not-know, though I have to wonder why it took over twenty years to get this story out) and giving the fishing industry well-deserved and too often long-overdue credit for “above and beyond” conservation efforts*, if at any point the bottom drops out of the Atlantic sea scallop or lobster fisheries, are the people at NOAA/NMFS preparing for such eventualities?
Good for the fish? For sure!
Good for the fishermen (or anyone whose paycheck depends in all or in part on their efforts) or for fresh, local seafood lovers? You be the judge!
*I’ll draw your attention to Atlantic swordfish landings – see Chart 7 above. The maximum inflation corrected
value for domestic landings was almost $105 million in 1992. In 2017 it was down to $17.5 million. The fact is
that recent landings are on the order of less than 20% of what they were during the peak years of the fishery, and
yet the fishery is being considered – by NOAA/NMFS, the responsible management agency – as a management
success. And similar plunges from record landings values in the first years of Magnuson management to 25% or
less of the post-Magnuson maximum is seen in Atlantic coast fishery after fishery.