Challenging NOAA’s “Arctic Report Card 2014” on polar bears
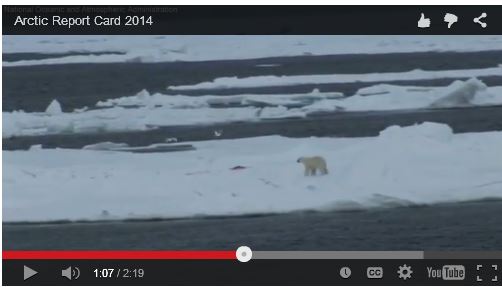 This year, polar bears are virtually the only species that NOAA mentions in their Arctic Report Card – they’ve put all their icon-eggs in one leaky basket [what happened to walrus??]. But polar bears are doing so well that to make an alarming case for polar bears as victims of Arctic warming, many important caveats had to be left out or misrepresented. Some details given are simply wrong. Read the rest here 08:30























report card is wrong
Dr. Susan Crockford: “A decline in survival of female polar bears of all age classes, from 1194 to 806, between 1987 and 2011 in western Hudson Bay was due to earlier sea ice break-up in the spring and later freeze-up in the autumn.”
Today, north-pole Arctic sea-ice is bigger and better than it was, this time in December, 2013, 2012, 2011, 2010, 2009, 2008, 2007, 2006, 2005. Only 2008 beats the current ice extent, all the way back to 2005.
http://nsidc.org/arcticseaicenews/charctic-interactive-sea-ice-graph/
”The number of polar bears observed in 2012 was high relative to similar surveys conducted over the past decade.”
”Body condition appeared relatively normal for this time of year with most bears reported to be in average body condition.”
http://www.fws.gov/alaska/fisheries/mmm/polarbear/pdf/newsletter_2013_14.pdf
WESTERN HUDSON BAY POLAR BEAR AERIAL SURVEY, 2011
”Although capture-based studies in the Western Hudson Bay polar bear subpopulation (WH) have documented declines in abundance, survival, and body condition, these findings are inconsistent with local knowledge and perceptions. To address on-going debate about current abundance and continue the development of non-invasive research methods, we conducted a comprehensive aerial survey of WH, including Nunavut, Manitoba, and Ontario. We used a combination of overland transects oriented perpendicular to the coastline and extending up to 100 km inland, coastal contour transects, and small island sampling during the August, 2011 survey. We implemented both distance sampling and sight-resight protocols while sampling from helicopter and fixed wing platforms.”
”We recorded a total of 711 polar bear sightings, concentrated along the coastline and in the central and southern Manitoba and Ontario portions of WH, although bears were also regularly sighted inland in the Wapusk National Park region. We examined 4 datasets using distance sampling and sight-resight analyses and generated an abundance estimate of about 1,000 bears (95% CI: about 715 – 1398).”
http://env.gov.nu.ca/sites/default/files/wh_final_report_may_2012.pdf
I’d have to venture a guess and say it depends on which Algorithm they’re dancing to…
http://californiawaterblog.files.wordpress.com/2013/08/carson_smelt11.jpg
Striped bass!
NiICE ONE!
In other words it’s business as usual. They’ll use whatever Data supports their AGENDA!!!
Arctic temperatures, according to the satellites, show declines…
There is a Solar cycle that runs 11 to 13 years. We had beautiful Weather in 2000 and 2001. I was commercially jigging for Large Cod in Jan. Feb. on some Days in a Short Sleeve Shirt. Again in 2011 and 2012 Shrimping in the Northeast dressed for Fall Weather. There wasn’t much Snow shoveling to tend to during these periods either. As they say seeing is believing.