Nils Stolpe – So how are we doing? (2017 edition) A Report on our Domestic Commercial Fishing Industry
 June 30, 2017 Nils Stolpe, www.fishnetusa.com
I occasionally share my impressions of how the domestic commercial fishing industry is doing, using as my primary data source the NMFS online database “Annual Commercial Landing Statistics” at https://www.st.nmfs.noaa.gov/commercial-fisheries/commercial-landings/annual-landings/index.We are fortunate to have these extensive records of commercial landings of fish and shellfish in the United States extending back to 1950 because they allow a fairly comprehensive view of long term industry (and resource) trends.
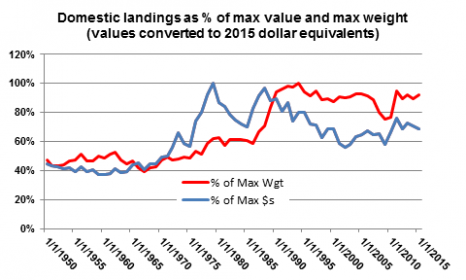
Among the most useful statistics are those dealing with the value and weight of the total landings for each year. Together they give an overview of how the domestic fishing industry is progressing (or regressing) from year to year. I’ve tried to incorporate that in the chart below, but rather than using the specific weights and dollars I converted them to the percentages of the maximum weights and dollars (and corrected the value of landings for each year for inflation using the US Inflation Calculator at http://www.usinflationcalculator.com/). As an example, the cumulative rate of inflation between 1950 and 2015 is 983%. Thus the $336,266,187 of fish and shellfish landings reported in 1950 was worth $3,307,087,254 in 2015 dollars.
From a weight-of-landings perspective it looks as if the commercial fishing industry nationally isn’t doing too badly. Unfortunately that isn’t the case from an income perspective, with recent landings being in the range of from under 60% to approaching 80% of 1979, the peak year for value of landings (at almost $4.5 billion when adjusted for inflation).
Each year’s weight and (corrected) value is represented by its percentage of the maximum weight (4,752,254 metric tons in 1994) and maximum value ($7,418,658,938 in 1979). This allows for fairly accurate year-to-year comparisons.
At the macro-level this chart shows that U.S. commercial landings have dropped in the neighborhood of 5% below their maximum level of production in 1994. However, the value of those landings appears to have declined at a significantly greater rate. The value of the landings in the year with the peak weight was only 80% of the maximum value of landings, and that relationship appears to have continued and for the most part increased. It’s safe to say that over the last quarter of a century domestic fishermen have been catching more for a significantly smaller return.
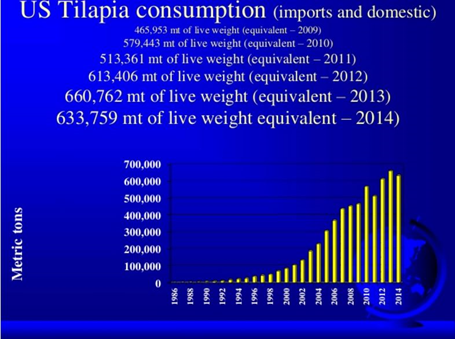
This could at least partially be a function of a relative increase in the production of lower value fish, or of market pressures (as it’s illustrated below, consider the extraordinary growth of the domestic tilapia demand and its possible market impacts on domestically produced seafood).
(From Fitzsimmons, K., Tilapia Aquaculture 2016, Eleventh International Symposium on Tilapia in Aquaculture, https://cals.arizona.edu/azaqua/ista/ISTA11/ISTA11.htm),
But of course the national performance doesn’t mean much to the many businesses that are dependent on one or several fisheries.
Getting more specific, I have charted the weight and inflation adjusted value of the twenty-five most valuable domestic fisheries as of 2015. To list them in order of descending value, they are American lobster, walleye pollock, sea scallops, Pacific cod, blue crabs, sockeye salmon, eastern oysters, Atlantic menhaden, snow crabs, pink salmon, Pacific halibut, sablefish, Dungeness crabs, king crabs, bigeye tuna, chum salmon, chinook salmon, Pacific geoducks, northern quahogs, spiny lobsters, Atka mackerel, tanner crabs, Pacific oysters, stone crab (claws) and yellowfin sole (all of these charts are available in a Adobe Acrobat document at http://www.fishnet-usa.com/Top25Fisheries_2015.pdf).
Thus, Atlantic menhaden, one of our largest fisheries, had maximum landings of 1.36 million metric tons in 1983 valued at 290 million dollars (in 2015 dollars) while the maximum value landed was in 1973 for 850 thousand metric tons valued at just over $400 thousand (again in 2015 dollars). Atlantic Menhaden Landings in 2015 were 740 thousand metric tons, valued at just under $180 thousand. This was 45% 0f the maximum weight of Atlantic menhaden landed and was worth 54% of the maximum value.
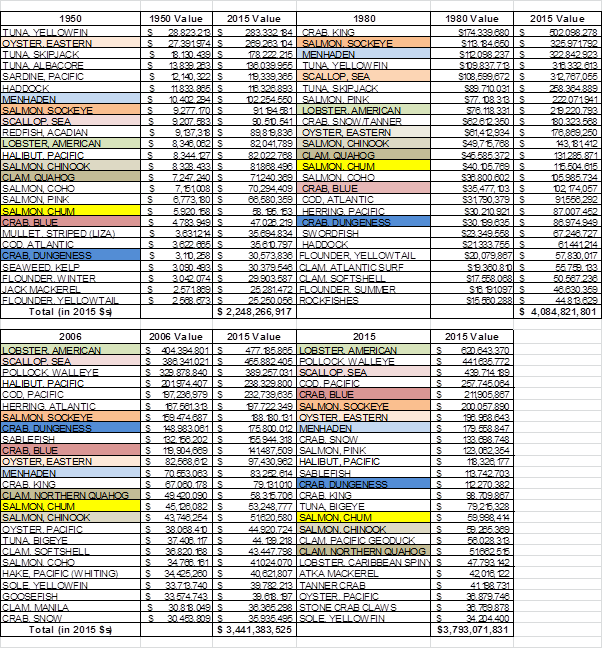
The table below lists the 25 most valuable fisheries for 1950 (the earliest year for which catch data is available on the Commercial Landings web site), 1980 (post-Magnuson), 2006 (post-SFA) and 2015 (the most recent year with landings data available). The landed value is reported for the particular year as well as that value adjusted for inflation (“2015 Value”). Ten fisheries have consistently been in the top twenty-five. These are in colored cells.
(Note that because of naming inconsistences the various shrimp groups were omitted. Among our most valuable fisheries, if they were included a number of them would have been listed in the top 25 for at least one of the four years and several for more than one year.)
Looking at the performance of the top 25 fisheries, generalizations seem to be pretty hard to come by. Some are and have be trending upward fairly steadily since the fishery began (bigeye tuna, American lobster), some trending steadily downward (Eastern oysters until oyster aquaculture got serious, king crab since the peak production), many a significant decline in the last decade or so
(Dungeness crab, king crab, chinook salmon, northern quahogs, sablefish, halibut), and others are impossible to categorize, seeming to vary randomly. If only the last ten years – since the SFA was passed, it appears to be about a tie between winners and losers (with the winners slightly in the lead) as far as production is concerned.
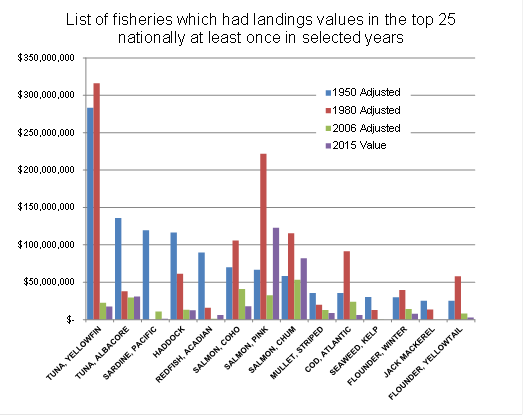
The chart below indicates the great range in the value of landings in the four years selected in various “top 25” fisheries. Note that the 1950 value was at or approaching peak levels in six fisheries as it was in the immediate post-Magnuson period (1980). The wide variations could be caused by resource/environmental, economic or political factors, or any combination, but they make clear the lack of stability in many of our fisheries – and are a good argument for the difficulty (futility?) of attempting to manage for anything like a “constant harvest” unless the harvest is reduced to such an extent that natural cycling becomes the overwhelmingly dominant population determinant.
The situation in the Mid-Atlantic
I treated what I consider the fourteen major ocean-based fisheries in the Mid-Atlantic region as I did the national “top 25.” Then I went one step beyond that and graphed only the last ten years – again as percentages of the peak production of each fishery since 1950. I also included linear trend lines for both the weight and the (inflation corrected) values of the landings. The values of landings are in blue and the weights in red (go to http://www.fishnet-usa.com/MidAtlanticFisheries_2015.pdf).
Eight of the fourteen fisheries have had both production and value trending down for the past decade and two, sea scallops and loligo squid, haves had production heading down but value increasing. Considering the ongoing major cuts in the summer flounder TAC I have no doubt that as soon as the 2016 landings are included they will be heading downward as well. Over 70% of the Mid-Atlantic fisheries will be in a state of decline.
So what does this all mean?
Beyond what seems to be the inescapable conclusion that if maximizing production is the goal we aren’t doing a particularly good job managing our fisheries, at this point your guess is at least as good as mine. Based on what seemed to be some inconsistencies in summer flounder trawl survey/landings data post-SFA (see https://fisherynation.com/58407-2), over the next month I am planning on examining how indices of abundance (aka surveys) relate to landings in particular fisheries – again with a focus on Mid-Atlantic/Northeastern fisheries. Perhaps this additional data will contribute to a more clear picture of what’s going on in some of our fisheries and in their management.
____________________
In 2015 the National Marine Fisheries Service Commercial Landings database reported on 485 species/fisheries. The most valuable of these fisheries, that for American lobster, landed 66,500 metric tons worth $620 million at the dock. The least valuable, that for leather skin (https://www.tradeindia.com/fp474459/Leather-Skin-Fish.html), reportedly landed 4 pounds worth $8. The walleye pollack fishery, the largest in 2015, produced over 3.2 billion pounds. The leather skin made the list as the smallest fishery as well. Domestic fisheries may be managed by international organizations, tribal councils, federal, state or local agencies, or combinations of these groups. Domestic fish and shellfish can be caught by multi-million dollar state-of-the-art fishing vessels or folks slogging around on mud flats with shovels and buckets (I have no idea how the 4 pounds of leather skin were caught). The landed value of domestically produced fish and shellfish ranges from pennies to tens of dollars per pound (the 2.6 million pounds of Pacific geoduck returned $56 million to the producers). And there is – to me, at least – a surprising inconsistency in year-to-year landings in virtually all fisheries.
The domestic commercial fishing industry could best be described as diverse, and deciding how to characterize its performance over time was a bit of a challenge. Taking into account the fact that in 2015 the 25 most valuable fisheries accounted for 78% of the value of the total landings, I decided to focus on these top fisheries. Considering that the weight produced in particular fisheries could vary by several orders of magnitude compared to other fisheries, the weights landed are expressed as percentages of the maximum landed weights reported. All of the landings values have been corrected for inflation, using 2015 equivalents and are also presented as percentages of maximum (corrected) value. This should allow for useful year-to-year comparisons within and between particular fisheries.
The Excel spreadsheet containing all of the data I used for this FishNet is just under a megabyte in size. If you wish a copy, email me at [email protected].


