


Trawl Surveys, what are they good for? – Nils E. Stolpe/FishNet USA
Nils E. Stolpe/FishNet USA
July 27, 2017
(Note that I am only addressing the NOAA/NMFS reliance on bottom trawl survey data in finfish stock assessments. I am not questioning the value of the wealth of biological and physical data that this long – running series of surveys generate.)
“The spring and autumn bottom trawl surveys conducted by the Northeast Fisheries Science Center are the longest running continuous time series of research vessel sampling in the world. The autumn survey began in 1963; the spring in 1968 (Azarovitz 1981). These surveys cover the ocean environment from 5 to 200 fathoms deep, from Cape Hatteras, North Carolina to well beyond the Canadian boarder [sic]. About 300 half-hour trawl sets are made at sites (stations) randomly chosen prior to the beginning of each survey. The objective of each tow is not to catch large numbers of fish, but to capture a representative sample of the various species and relative numbers in a given area. The distribution of trawling locations is allocated according to a statistical method that divides the region into a number of smaller areas (strata) with similar depth characteristics. The method is a stratified-random sampling design, and is commonly used for a wide variety of statistical estimates, including exit polling for elections. In the history of the trawl surveys, only three research vessels — NOAA’s FSV Henry B. Bigelow, FRV Albatross IV and the FRV Delaware II — have been used to conduct these surveys.” Click here .
“The NEFSC bottom trawl survey is a fisheries independent, multi-species survey that provides the primary scientific data for fisheries assessments in the U.S. mid-Atlantic and New England regions,” NOAA National Centers for Environmental Information, Click here
For the fishing industry in the mid-Atlantic and New England the results of the two annual – with three annually for a few years ending in 2008 – bottom trawl surveys are more important than any other factor in determining what the upcoming harvest in several dozen fisheries will be.
According to NOAA/NMFS these surveys have provided and continue to provide “the primary scientific data” for fisheries assessments from North Carolina to Maine (fisheries assessments are the periodic – generally held every 3 to 5 years – scientific/bureaucratic exercises. In NOAA’s words “NOAA Fisheries’ scientific stock assessments are critical to modern fisheries management. Using data gathered from commercial and recreational fishermen and our own on-the-water scientific observations, a stock assessment describes the past and current status of a fish population or stock, answers questions about the size of the stock, and makes predictions about how a fishery will respond to current and future management measures.”)
Needless to say, these stock assessments are of overriding importance to anyone who is dependent on fish and fishing, and the annual bottom trawl surveys provide the scientific underpinnings for management decisions in those fisheries for the majority of species in the Northeast region.
This being the case, I thought that it would be instructive to examine the relationship between the survey results and the commercial landings for some of the species which the surveys sample. I used what I judged to be the twenty-one most valuable/important species and ignore several (sculpin, little skate, etc.) which I judged to be of less commercial significance.
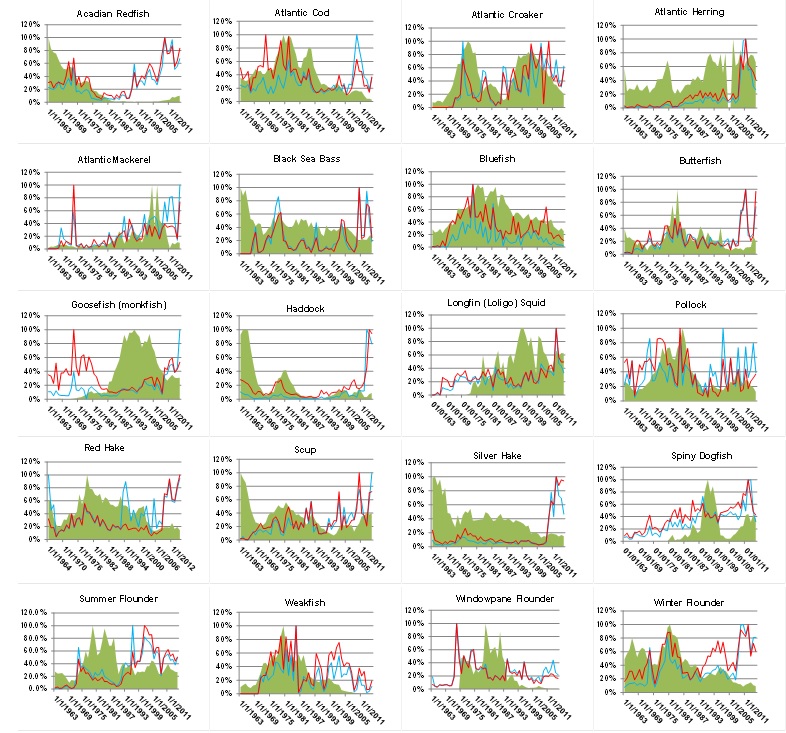
So how accurate are these bottom trawl surveys – and the stock assessments which depend on the information they generate? I doubt that there are easy answers to these questions, and I’m certain that if there are, I don’t have them. But in an attempt to provide you with enough information to at least begin to consider such questions I’ve charted the survey results and commercial landings going back to 1963 for twenty mid-Atlantic/New England fisheries. 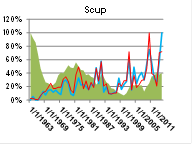 As in my last FishNet, (So how are we doing? (2017 edition) A Report on our Domestic Commercial Fishing Industry (click here) instead of considering the actual survey results and landings I’ve charted each annual datum as a percentage of the maximum for that species (i.e. the 1977 total survey count for scup – blue line – was 18,549, 30% of the maximum total count of 61,818 in 2015, the 1977 total survey weight – red line – was 830 kilograms, 35% of the maximum of 2,387 kilograms in 2010, and the 1977 commercial landings – green area – were 8,699 metric tons, 35% of the maximum landings of 19,015 metric tons in 1963).
In 1963 when only one trawl survey was done the total weights/counts for that survey were used, in subsequent years when two or three surveys took place the total weights/counts were divided by two or three respectively.
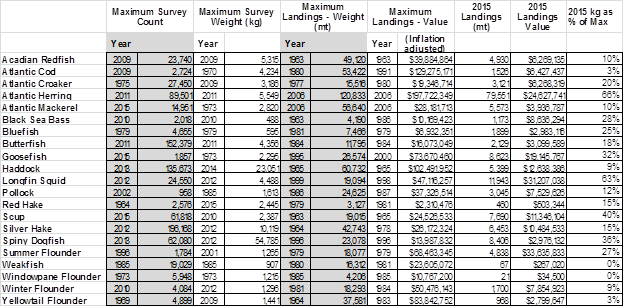
Beneath each species chart I have recorded the maximum (100%) numbers for fish sampled each year, weight of sampled fish, and commercial landings.
Below are thumbnails of twenty-one charts.
Larger images are available. Click here
While the charts are all similarly sized, keep in mind that they represent fisheries with landings that ranged from 3,000 to 120,000 metric tons valued at $2 million to almost $200 million per year.
The table below details the maximum survey results (count and weight) for each fishery (the 100% point in each chart above), maximum landed weight and value (corrected for inflation), the weight and value of the 2015 landings and the percentage of the maximum landed weights represented by the 2015 weights.
Among the secondary questions that this raises are 1) are the trawl surveys – at least in the Northeast – worth their cost, 2) should the trawl survey results be accorded the importance in stock assessments that they are, 3) is the situation similar in the other NOAA/NMFS regions, and 4) is there a more cost effective way to generate more useful/relevant data? But the most important question – particularly in view of the last column in the above table (2015 landings as % of Max) is how much the of the domestic commercial fishing industry is being sacrificed on the NOAA/NMFS/ENGO alter of sustainability? The commercial landings of these 21 species in 2015 were on the average only 21% of the maximum landings for each species since 1963. Such a level of underfishing surely isn’t what sustainability – or conservation – is supposed to be about.
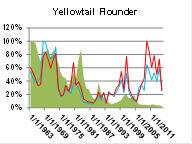
 Finally, for reference, I used a random number generator to get 53 random numbers between 1 to 100 and treated the generated numbers as I did the survey weights and numbers. Below I superimposed the graph of these numbers over the Atlantic Croaker landings graph. (There was no particular reason I used croaker landings. Any of the 21 species would have served the same illustrative purpose.)
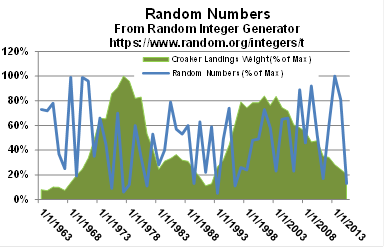 The most obvious take-away message I could glean from all of this is that, at least to a statistically unsophisticated eye there is no apparent relationship between the trawl survey results and commercial landings among all twenty-one species that I focused on. I can’t say that when the sample numbers and/or weights go up the landings will increase correspondingly or that when the landings go up the sample numbers and/or weights will go down correspondingly. In fact the random numbers chart, to my perhaps untrained eye, could be substituted for any of the twenty-one other charts and nothing about it would jump of the page at a reader.
Among the secondary questions that this raises are 1) are the trawl surveys – at least in the Northeast – worth their cost, 2) should the trawl survey results be accorded the importance in stock assessments that they are, 3) is the situation similar in the other NOAA/NMFS regions, and 4) is there a more cost effective way to generate more useful/relevant data? But the most important question – particularly in view of the last column in the above table (“2015 landings as % of Max”) is how much of the domestic commercial fishing industry is being sacrificed on the
NOAA/NMFS/ENGO alter of sustainability? The commercial landings of these 21 species in 2015 were on the average only 21% of the maximum landings for each species since 1963. Such a level of underfishing surely isn’t what sustainability – or conservation – is supposed to be about.
(I’m encouraging comments on this FishNet and will distribute those that I receive, either pro or con. Thank you,)
The comments are open on this page.


Leave a Reply